From a heading to a chart
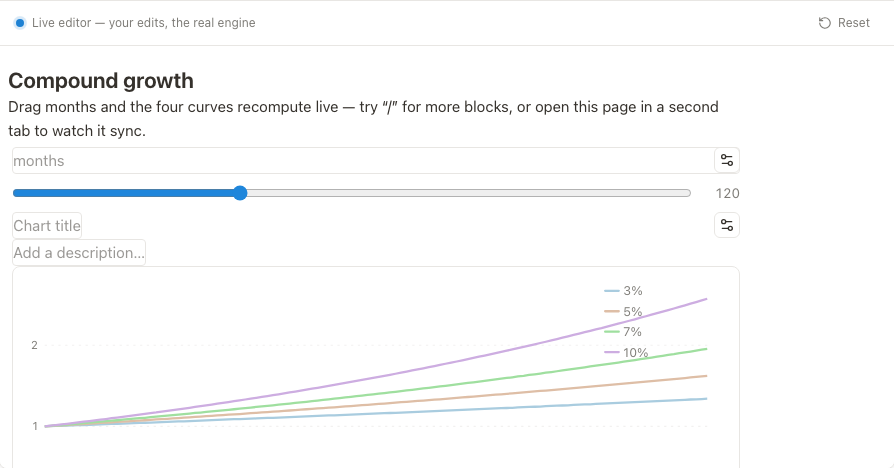
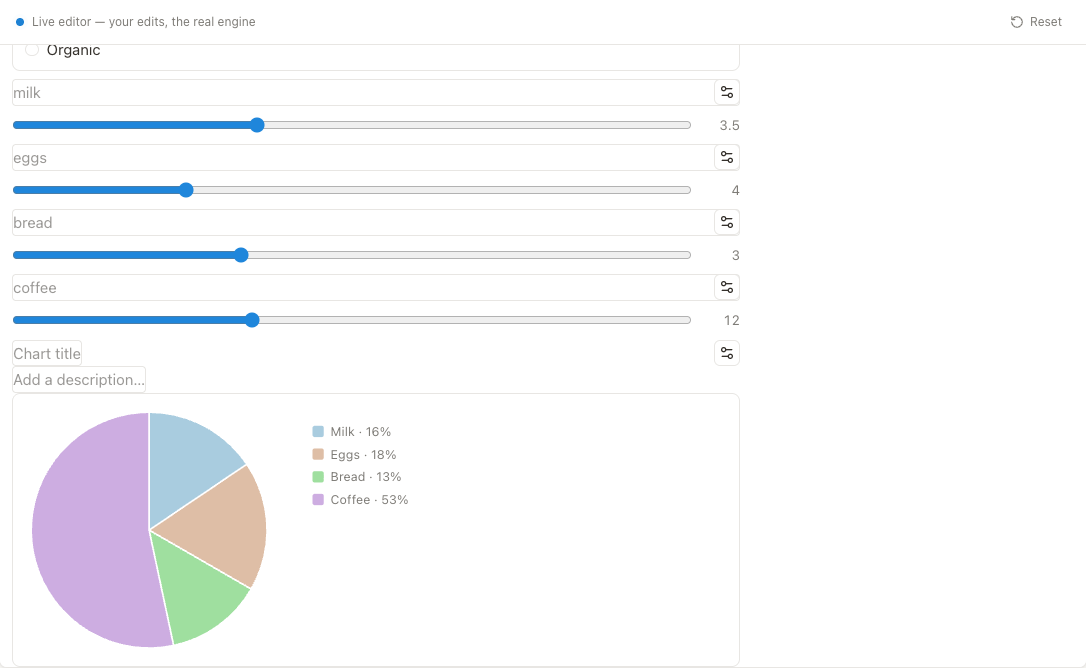
Start with the blocks you'd expect. Then wire a slider to a formula, and the formula to a chart.
 Loading the live editor…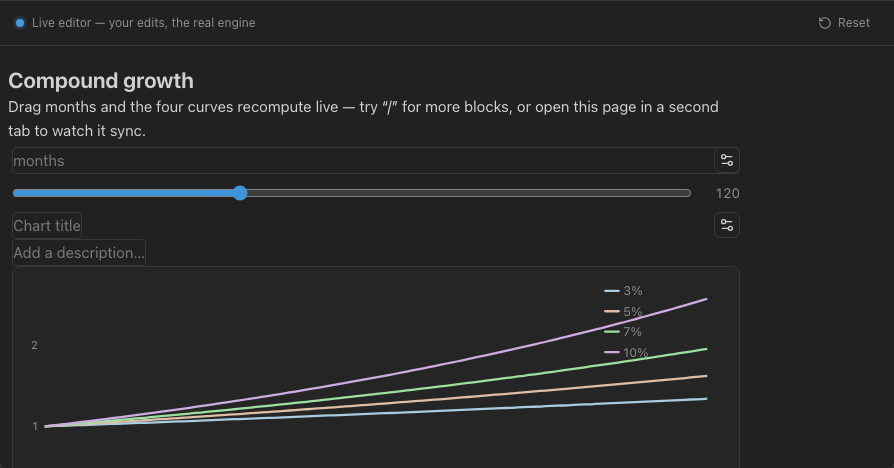
Write the page, then wire it up
Headings and to-dos come first. Then a slider publishes a number and a formula picks it up.
Rich blocks
Press “/” for a callout, a table or a code fence. Drag one beside another to make columns.
Reactive kit
A slider publishes a named value. Anything downstream that reads that name redraws.
Live formulas
Write an expression over those values. Change one and the result updates in place.
A database that sits in the page
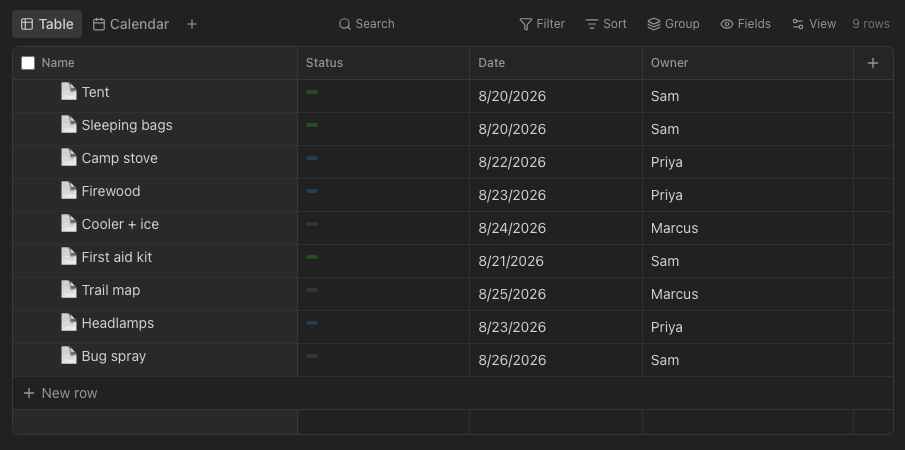
Filter it, group it, and pick how it draws. A chart can read the same rows.
Charts
Point a chart at a table and it redraws when the numbers move.
Databases
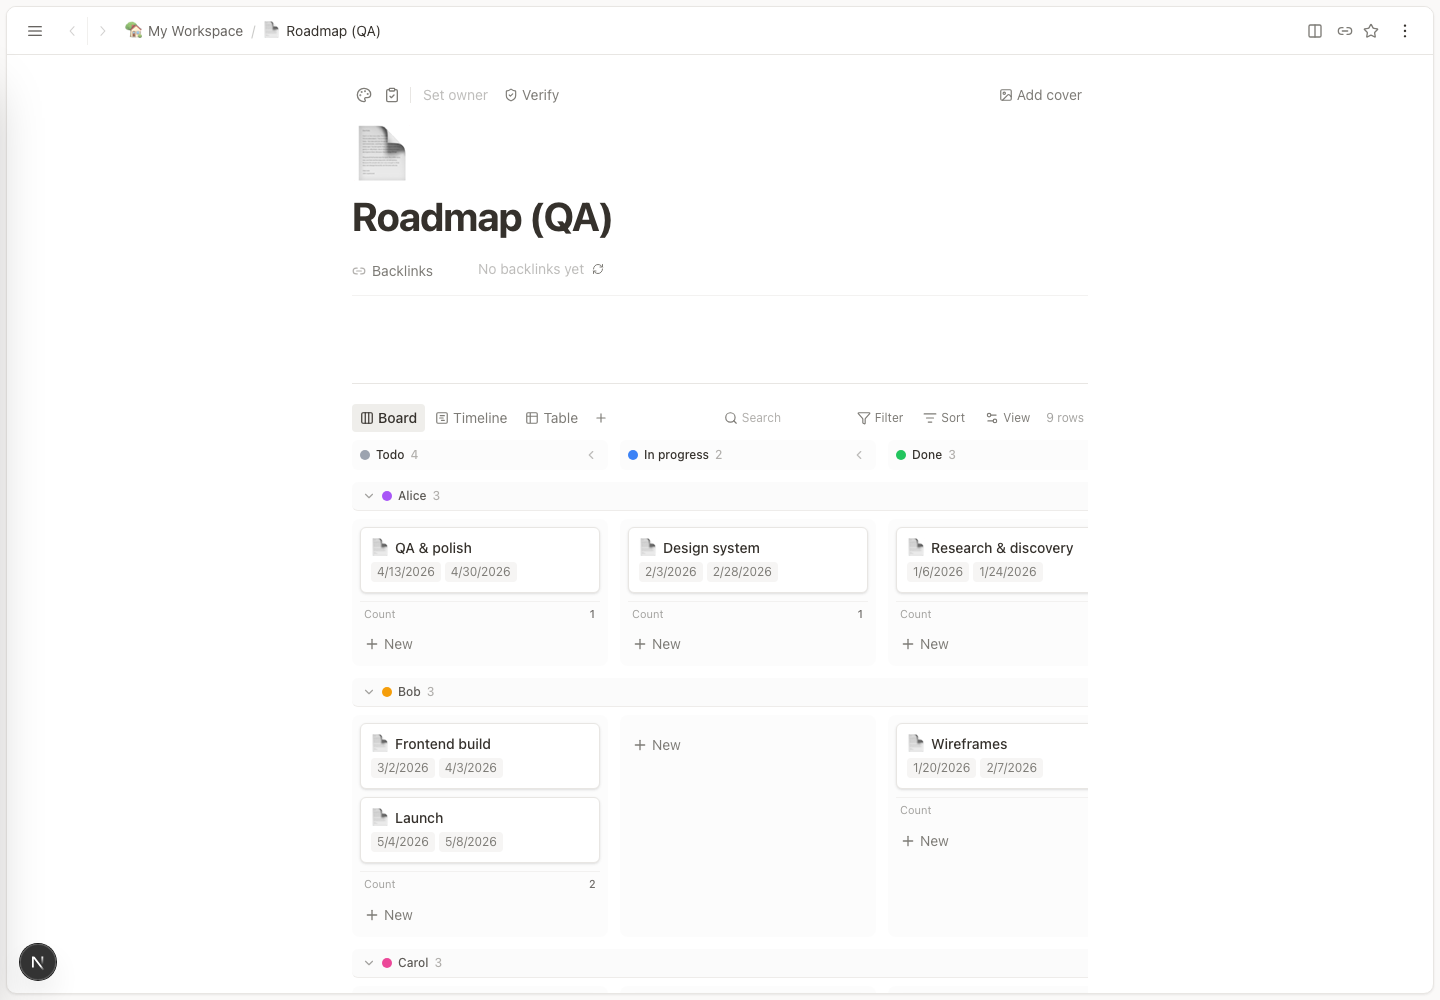
Columns are typed, and one can point at a row in another database. No query language.
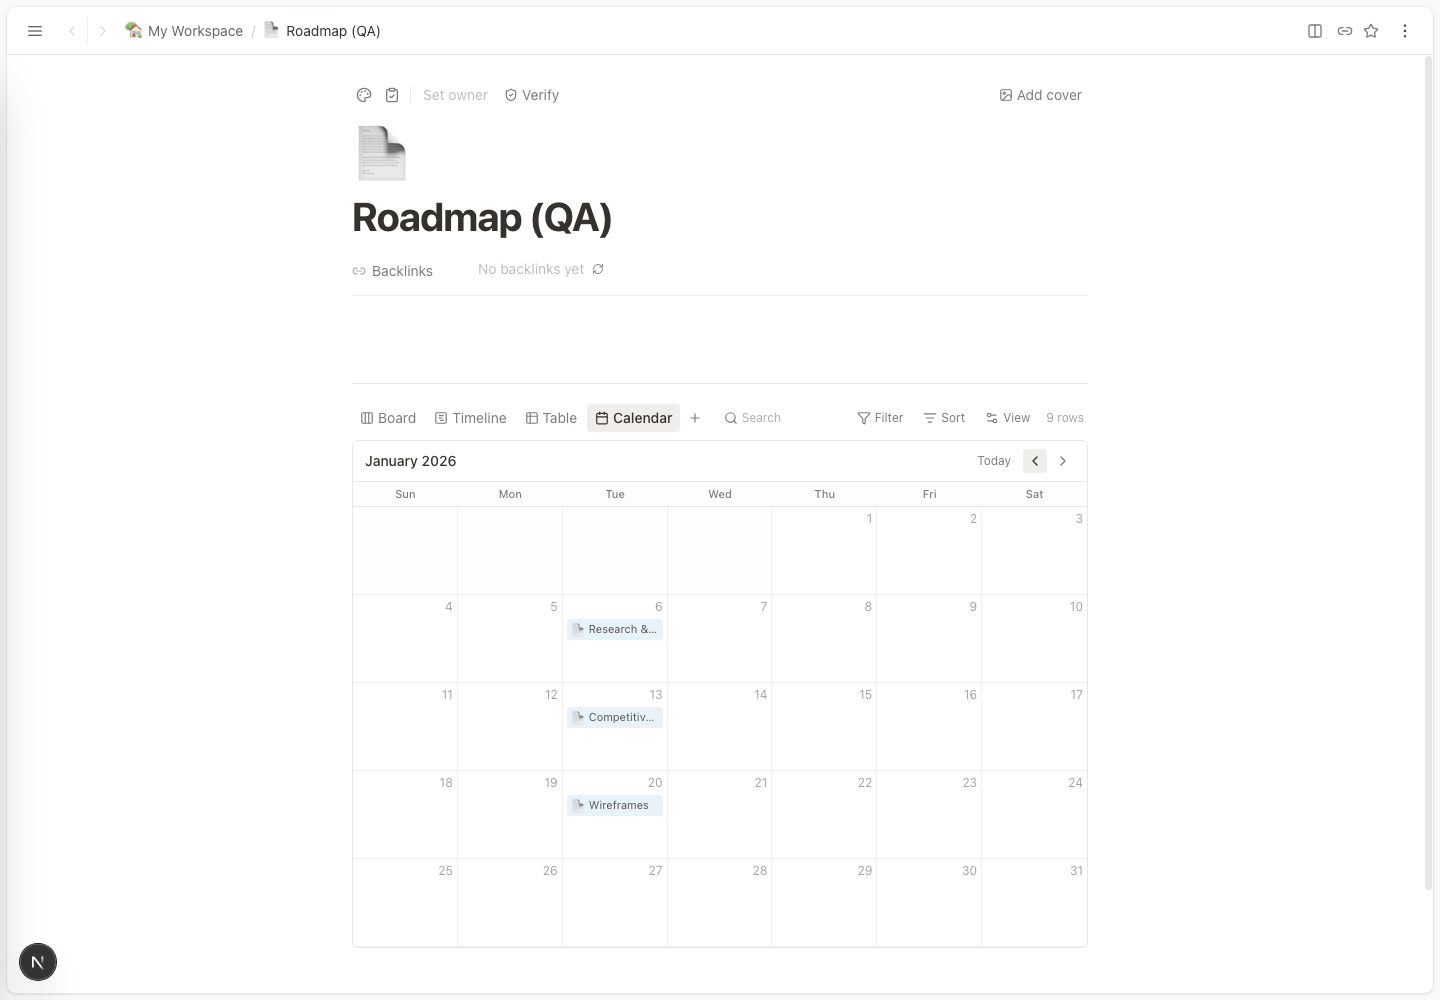
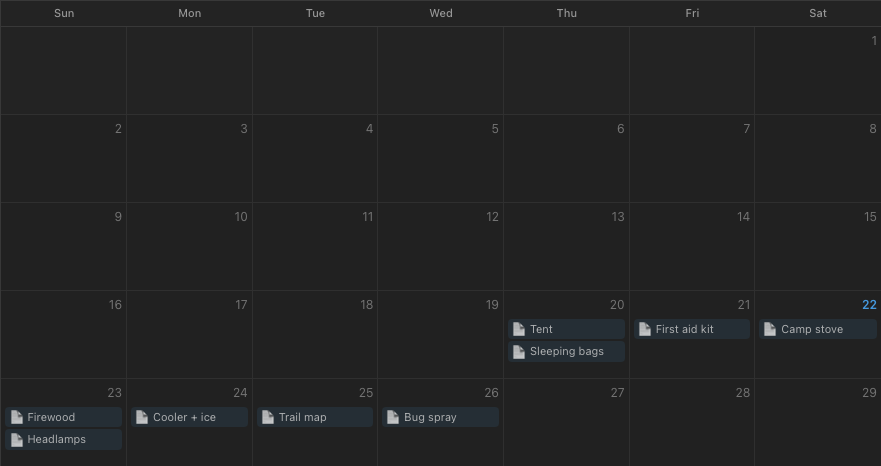
Six views
Table, board, gallery, calendar, swimlane, map. The same records, laid out differently.
Show the page, or hand it over
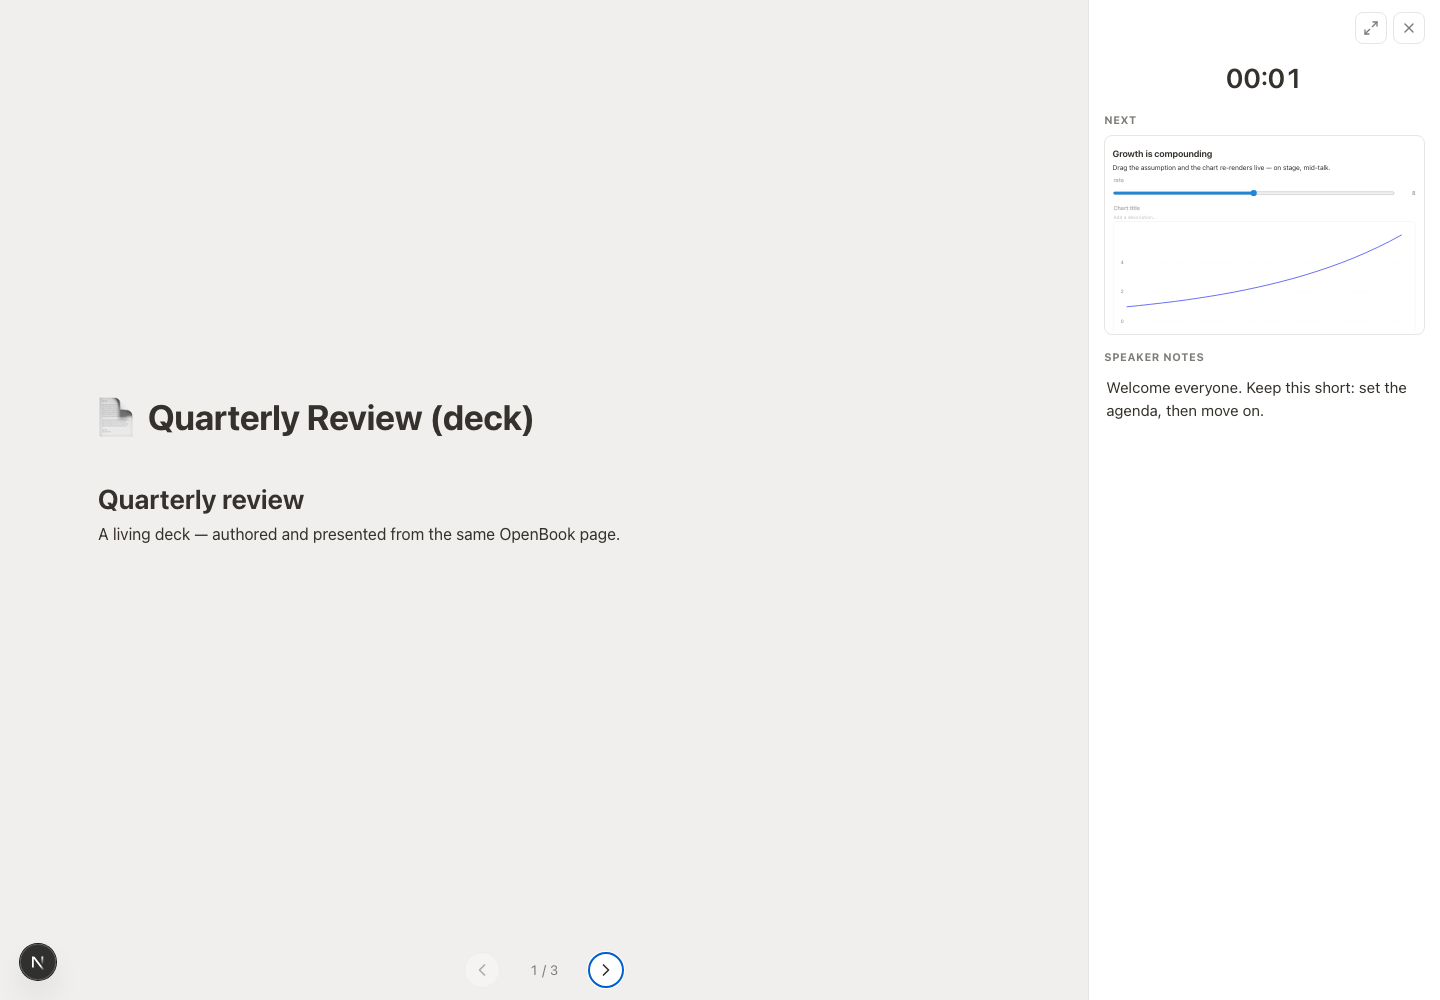
Dividers become slide breaks, and every widget stays live on stage. Hand the page to a reviewer instead and edits arrive as suggestions.
- Presenter console, with speaker notes
- Accept or reject each suggested edit
Send the page somewhere else
The page starts on your device. Getting it elsewhere is a sign-in or a download.
CRDT sync
Built on Yjs, a CRDT. Two tabs can hold the same page open and edit.
Local-first
Edits land in a local database first. Sync only runs when you sign in.
Lockable tools
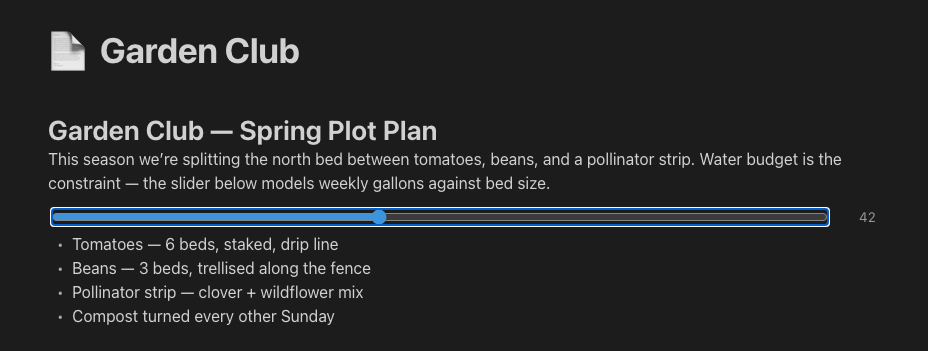
Lock a group of blocks. The sliders still move, the text stops being editable.
Open exports
HTML, PDF and Markdown. The HTML keeps its sliders working with the app closed.
Screens from the running app
 Loading the live editor…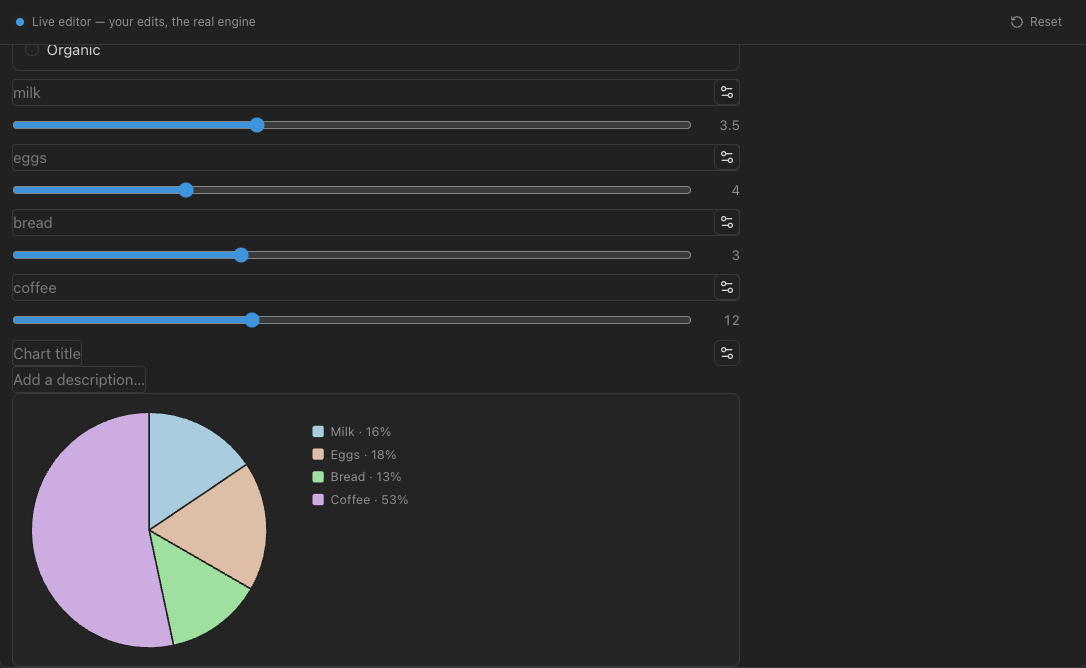
Try the interactive home demo
The home page shows sliders that recalculate a chart as you drag.